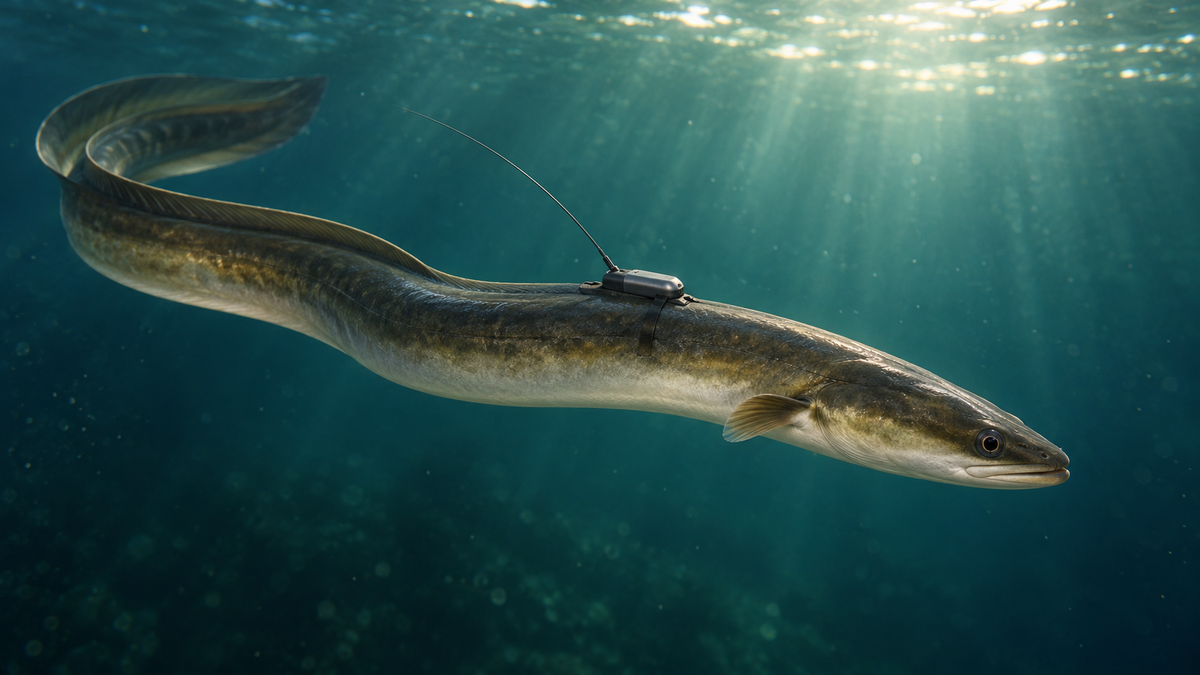
Satellite tags help researchers understand the conditions eels experience at sea and parts of their movements. They do not necessarily provide continuous underwater positions for every individual, and tag records alone do not establish that spawning occurred.
This article focuses on a study of Japanese eels, Anguilla japonica, published in 2023. It separates measurements, inferences and unanswered questions. The illustrations are conceptual, not records of actual research animals, attachment procedures, observation sites, tracks or measured results.
What does the equipment track?
A pop-up satellite archival tag, or PSAT, records environmental information while attached to a fish. After detaching and floating to the surface, it transmits information to satellites. This differs from a phone repeatedly sending GPS coordinates while the animal swims underwater.
Attachment methods and device size must be considered in relation to the species, body size and research question. This article is not a guide to tagging wildlife. Research on equipment and attachment methods
Sensor types determine which records are available
The label “satellite tag” does not establish which variables were measured. In the 2023 study by Abe and colleagues, two device types were used on 23 eels. Ten X-tags recorded depth, temperature and light. Thirteen mrPATs had temperature, tilt and wet/dry sensors. The mrPATs did not provide the same detailed depth time series as the X-tags.
When temperature changes, assessing whether the animal moved vertically or encountered a different water mass requires checking the sensors actually fitted and the recording intervals. Device specifications and analysis
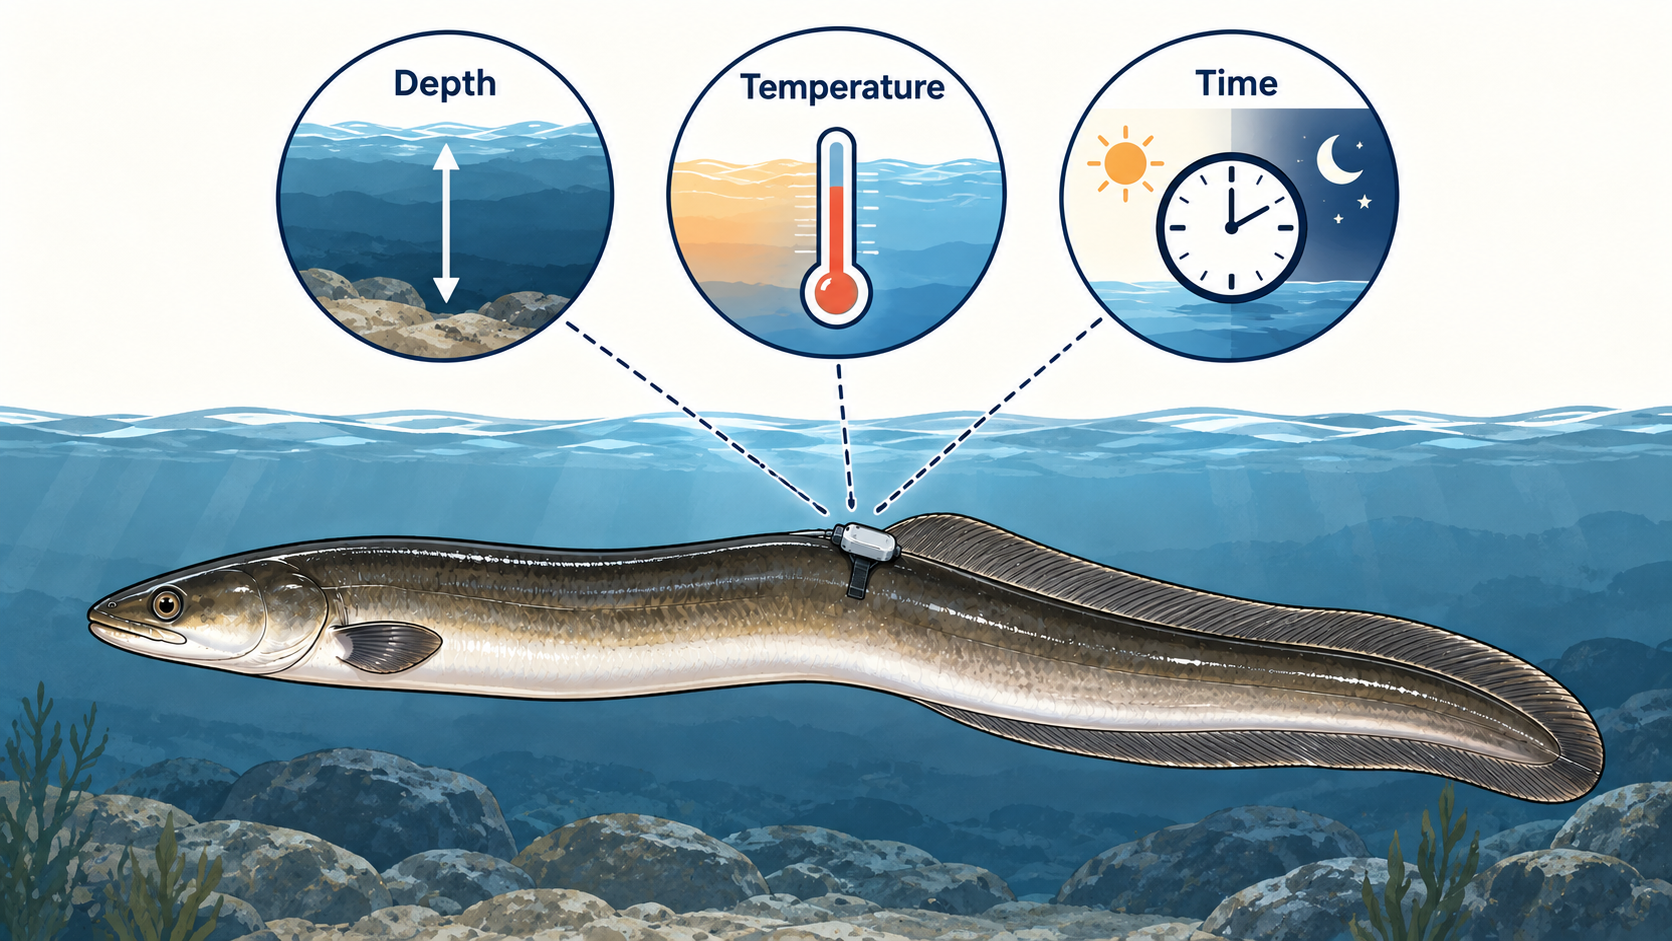
Recording and transmission happen at different times
The information pathway has distinct stages: underwater measurement, storage in the device, detachment and surfacing, and satellite transmission. Depending on the device, a preset schedule or conditions such as constant pressure or surface detection can trigger release or transmission.
Researchers distinguish the planned recording period from the time a tag actually remained attached. The 2023 study programmed periods of 4–8 months, but all tags detached prematurely. A planned duration cannot be counted as an achieved observation period. PSAT operating conditions
How is position determined?
A release position, a tag's first transmission position and an estimated intermediate position have different evidential bases. The 2023 Japanese-eel study tried a method using sunrise and sunset to estimate intermediate positions, but it could not be applied. The analysis used the great-circle distance and bearing between release and first transmission positions.
Great-circle distance is the shortest distance between two points on a sphere, not the animal's actual swimming distance. A surfaced tag may also drift before a transmission position is obtained. Check whether a line on a map represents continuous measurements, estimates or a convenient connection between endpoints. Position analysis
How should missing data be interpreted?
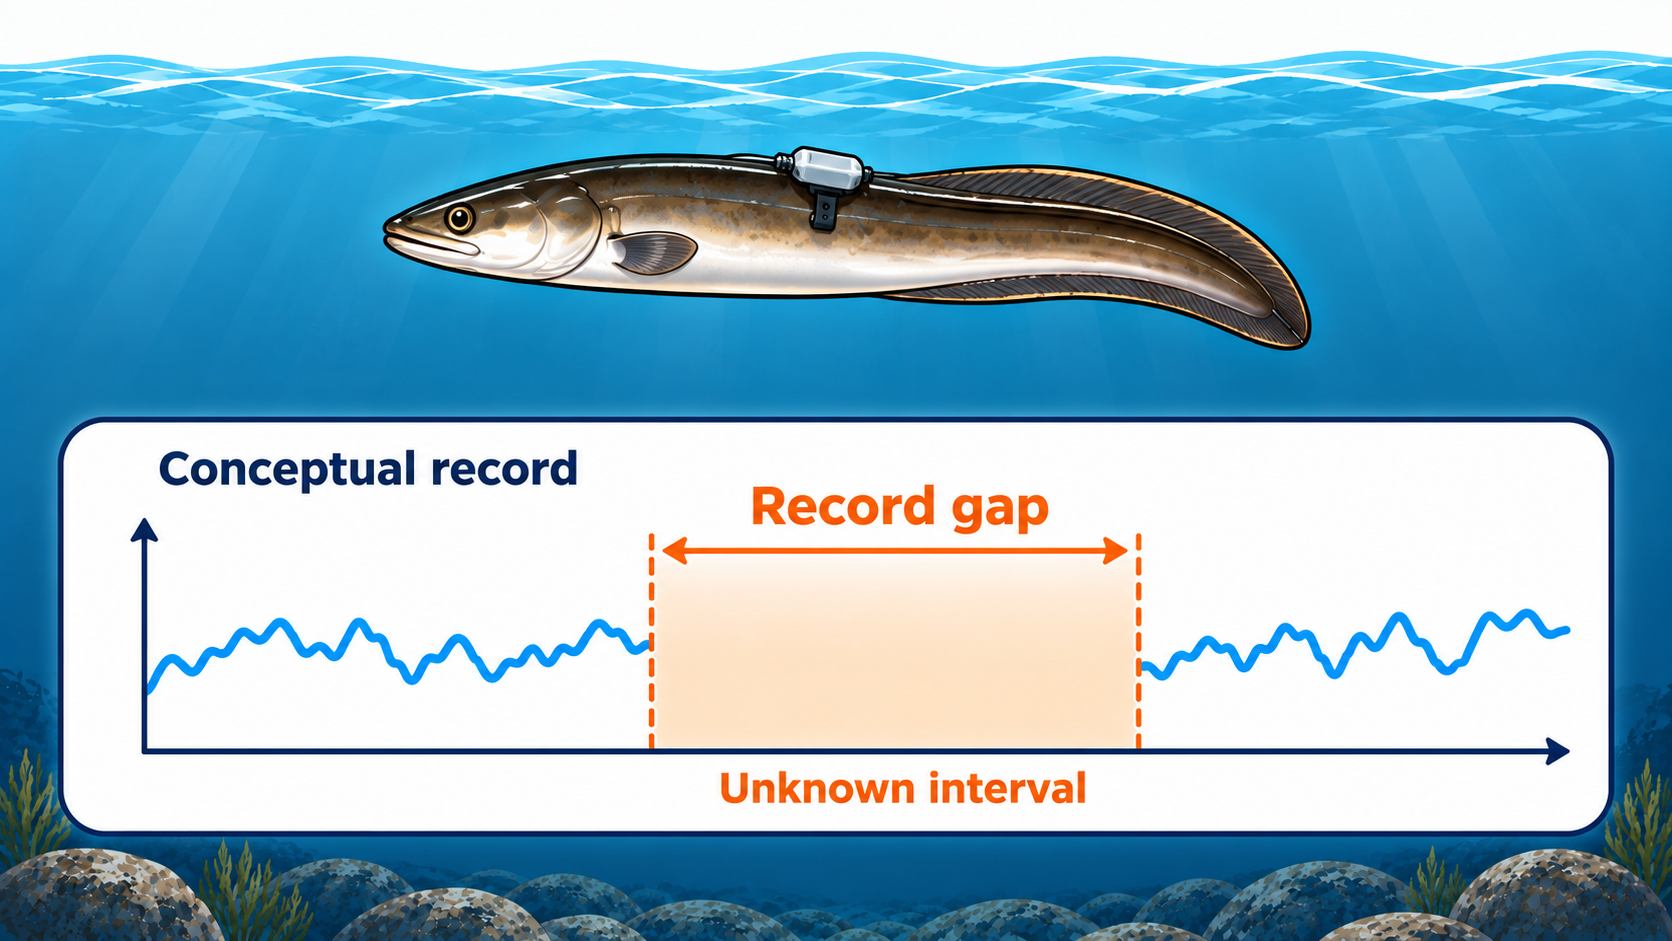
The study released 23 eels in total and received data from tags on 15 individuals. Reported attachment durations ranged from 1 to 59 days. The maximum of 59 days included an individual suspected of predation; excluding suspected predation cases, the maximum was 55 days. This does not mean that all 23 eels were continuously tracked for 59 days.
A detached tag, a failed transmission or ingestion by a predator can create gaps or change what a record means. An individual whose tag did not transmit is not necessarily dead. Nor can a specific route be assigned to an unobserved interval. Tag outcomes and limitations
Separate movement evidence from spawning evidence
Movement records help establish the environments an individual experienced and the sea areas it approached. Evidence of reaching a spawning region differs from observing that individual releasing eggs or sperm. A PSAT should not be treated as a filming device.
Equally, the absence of spawning footage from a tag does not imply an absence of evidence about spawning areas. Studies have collected Japanese-eel eggs and newly hatched larvae, advancing understanding through a different method. Egg and larval sampling research
Check species, release sites and sample selection
Read the scientific name, capture and release locations, silvering stage, body size, sample size and season together. Findings for Japanese eels cannot simply be transferred to the routes of European eels, Anguilla anguilla, or American eels, Anguilla rostrata.
The 2023 study covered three regions: Tokai, the Sea of Japan coastline and Tohoku. Eels weighing 750 g or less were not selected, to reduce potential effects of device drag. The sample should therefore not be assumed to represent eels of all sizes. Selection of study animals
Avoid reducing variation to a single route
Even within one species, records differ with the departure region and the vertical temperature structure of the sea. In the 2023 study, some Tokai individuals showed diel vertical migration, changing depth between day and night. One eel from the Sea of Japan coastline showed repeated vertical movements without that same diel pattern.
These are individual observations from that study. A small number of tracks or an average does not justify saying that every eel travels at the same depth, speed or along the same route. The roles of currents and active swimming must also be considered cautiously in light of the available records. Reported regional differences
Consider the tag's own effects
External equipment adds drag and buoyancy. Capture, handling and attachment may also influence behaviour. A 2013 European-eel study found that attachment methods differed in retention time, physical effects and immediate behavioural responses. Its results do not justify disregarding those effects.
The study also warned that records from the first 2–3 days after tagging might not reflect natural behaviour. Do not turn that interval into a universal exclusion rule for every species and device; read each study's methods and limitations. Handling animals belongs within professional research and animal-welfare procedures. Original attachment-method study
Combine evidence from different methods
Understanding migration and spawning requires combining tag information with evidence such as egg and larval sampling, species identification, maturity assessments and oceanographic observations. Aoyama and colleagues' 2014 paper examined Japanese-eel eggs and newly hatched larvae collected during 2011–2012 surveys in relation to oceanographic structure near the West Mariana Ridge.
Egg collections independently inform understanding of reproduction in an area. They do not, by themselves, establish that an individual tagged in another study spawned there. The subjects, dates and locations must be checked before linking the findings. Eggs, larvae and oceanographic structure
Identify the limits of a paper's conclusions
When reading a satellite-tagging study, check the species and sample, variables actually measured, duration and proportion of transmitted records, position-estimation method, missing data and possible tag effects. Distinguish observations, inferences drawn from them and hypotheses still awaiting tests.
The 2023 Japanese-eel study identified regional differences in the early marine phase. It did not establish complete routes from every growth habitat to the spawning area. Partial records remain valuable without filling unobserved sections with assumptions. The examples here are identified by publication year; this article does not claim to be an exhaustive or guaranteed up-to-date review of worldwide research. Conclusions and remaining questions
References
This independently written explanation reorganises findings from the original papers. It has not been supervised or endorsed by their authors. Sources checked on 13 November 2026.
Related articles